2026 Top Factors Affecting Fiber Optic Cable Performance?

Time:2026-10-26 Author:Mason
0%

In 2026, fiber optic cable performance depends on far more than the glass inside the jacket. Network engineers must examine attenuation, chromatic dispersion, bend loss, connector quality, splice accuracy, temperature, and installation stress. These details decide whether a link carries clean data or produces unstable readings after deployment.

So, what factors affect fiber optic cable performance? The answer begins with cable design and continues through every installation stage. A tight bend behind a rack can increase insertion loss. Dust on a connector end-face can weaken the signal within seconds. Excessive pulling tension may create hidden damage that appears months later. Poor matching between the fiber, transceiver, and network speed can also limit practical performance.

Professor Govind P. Agrawal, author of Fiber-Optic Communication Systems, offers a valuable systems perspective: “A fiber link must be designed as a complete system, not as an isolated cable.” That idea remains important for modern data centers, telecom networks, and industrial links. Testing should include power loss, return loss, optical time-domain reflectometry, and inspection under realistic conditions.

The overlooked detail matters.

Field experience also exposes uncomfortable gaps between specifications and reality. A cable may pass a factory test but fail after careless routing, moisture exposure, or repeated temperature changes. This guide examines the top performance factors for 2026, while recognizing one limitation: laboratory results cannot represent every field condition. Reliable decisions require measurements, documented installation practices, and periodic inspection.
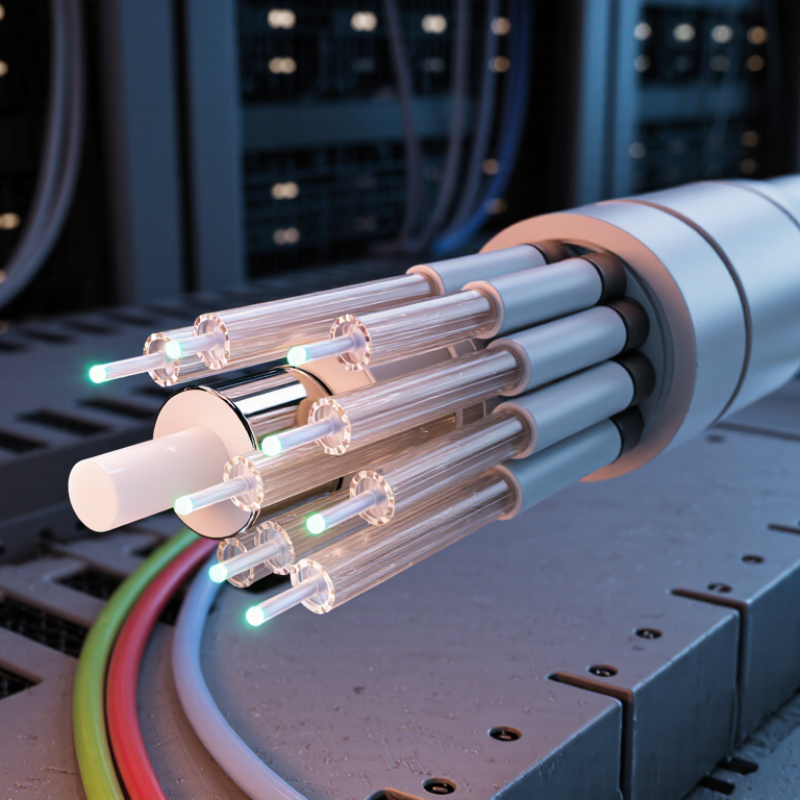
2026 Top Factors Affecting Fiber Optic Cable Performance?

Fiber Optic Cable Performance: Core Concepts and Measurement Criteria

Fiber optic cable performance is measured, not guessed from its datasheet. The core carries light, while cladding keeps that light confined. ITU-T G.652.D specifies maximum attenuation near 0.4 dB/km at 1310 and 1550 nm. Real links can perform worse because of splices, connectors, bends, and contamination.

Key criteria include insertion loss, return loss, chromatic dispersion, and polarization mode dispersion. An optical time-domain reflectometer can reveal a sharp splice event or a reflective connector several kilometers away. IEC 60793 testing also evaluates attenuation and mechanical reliability under controlled conditions. The Telecommunications Industry Association recommends measuring installed cabling with calibrated equipment, correct reference methods, and documented test limits. In practice, a clean connector often matters more than a perfect cable reel. I have seen a small dust particle create an unexpectedly large loss reading. A low-loss trace is not automatically a healthy link.

Tips: Clean, inspect, and cap every connector before testing. Use both light-source-and-power-meter tests and OTDR traces. Record wavelength, launch conditions, cable length, temperature, and equipment calibration date. Compare results with the project budget, not only the factory specification. A single failed test should trigger investigation, not immediate cable replacement. Sometimes the test setup is the real fault.

Fiber and Cable Design Factors That Shape Signal Quality

Fiber optic performance begins with geometry, not marketing claims. The core diameter, cladding alignment, and refractive-index profile determine how light travels. Small manufacturing variations can increase attenuation or modal noise. A cable may pass a basic light test yet perform poorly at higher data rates.

Bend control matters in real installations. Tight corners can create macro-bending losses, especially near patch panels and closures. Designers should specify a minimum bend radius for both installation and long-term service. Fiber coating, buffer size, and jacket flexibility also affect this limit. Temperature changes add stress. Outdoor cables need materials that resist moisture, ultraviolet exposure, and repeated expansion.

Connector quality remains a frequent weakness. Dust on an end face can scatter light and raise insertion loss within seconds. Technicians should inspect, clean, and test every connection with calibrated equipment. OTDR traces can reveal reflective events, poor splices, and unexpected cable damage. Insertion-loss testing confirms the link’s actual power budget. Standards such as IEC 60793 and IEC 60794 offer useful design references, but field conditions still matter. A clean spreadsheet can mislead. I have seen acceptable calculations fail after careless routing or rushed termination. Cable design should leave practical margin, not just meet the theoretical limit.

Installation and Environmental Conditions Affecting Cable Performance

2026 Top Factors Affecting Fiber Optic Cable Performance?

Installation and environmental conditions can determine whether a fiber link remains stable for years or develops intermittent faults. Cable performance often changes before test equipment detects a clear failure.

During installation

During installation, crews should follow the specified bend radius, pulling tension, and pulling speed. A tight corner can create microbends and increase signal loss. Excessive pulling force may damage the fiber beneath an undamaged jacket. Keep ducts clean and avoid dragging cable across sharp edges. Small mistakes matter.

I have seen installation plans fail because they considered distance but ignored temperature. Outdoor cables may face intense sunlight, freezing nights, moisture, and repeated expansion. These cycles can stress jackets, closures, and connection points. Water entering a poorly sealed enclosure can travel farther than expected. UV exposure may also make an unsuitable jacket brittle over time.

Cable trays should avoid standing water and unnecessary heat sources.

Cable trays should avoid standing water and unnecessary heat sources. In areas with vibration, secure the cable without crushing it. Leave enough slack for maintenance, but not loose coils that kink easily. Technicians should inspect routes before installation, record test results, and retest after major environmental changes. A perfect first-day reading can be misleading. One overlooked bend may appear months later. Disposal and repair plans also deserve attention, because rushed field corrections can introduce new damage.

Operational Practices, Aging, and Maintenance Effects

2026 Top Factors Affecting Fiber Optic Cable Performance?

Operational discipline often determines fiber performance more than cable specifications. Poor bend control, excessive pulling force, and loose closures can increase attenuation and reflection. ITU-T G.652.D specifies maximum attenuation near 0.4 dB/km at 1310 nanometers under defined conditions. Field conditions are less forgiving. A cable routed around a sharp cabinet edge may pass today, then fail after seasonal movement. Connector contamination remains a major practical risk. The Fiber Optic Association reports that dirty or damaged connectors account for a large share of link faults. Small particles matter.

Aging adds slower, less visible changes. Repeated temperature cycles can stress jackets, splice trays, and connector interfaces. Moisture ingress may accelerate corrosion and raise insertion loss. IEC 61300-3-35 recommends inspecting fiber end faces before connection, yet technicians sometimes skip inspection during urgent repairs. That shortcut is understandable, but risky. A power meter reading alone cannot reveal every reflection or intermittent defect. Real networks are messier than test sheets suggest. Maintenance records should include loss trends, bend locations, cleaning actions, and environmental alarms.

Tips: Clean and inspect both connector ends before mating. Respect the manufacturer’s bend radius and pulling limits. Test baseline loss after installation, then compare it during scheduled maintenance. Use OTDR traces for suspected events, not as a substitute for visual inspection. Review unusual results twice; one strange trace may expose a testing error, not cable aging.

2026 Top Factors Affecting Fiber Optic Cable Performance

Operational practices, aging, and maintenance effects on typical field performance

The comparative impact score reflects common field conditions: contamination and poor connector handling can create immediate insertion loss, while excessive bend radius, tensile stress, moisture ingress, and long-term aging can increase attenuation or return loss over time. Regular inspection, cleaning, bend-radius control, and optical power testing help preserve performance.

Testing, Troubleshooting, and Performance Optimization in 2026

In 2026, fiber optic performance depends on measured conditions, not installation claims. A field test begins with connector inspection, end-face cleaning, and reference-setting. Technicians should measure insertion loss and optical return loss at every required wavelength. OTDR traces reveal reflective events, excessive attenuation, and damaged splice points. Test from both directions when accuracy matters. One trace can mislead. Record temperature, cable length, launch conditions, and test equipment calibration. These details support reliable acceptance decisions and audit requirements.

Troubleshooting should follow the signal path, not guesswork. Compare current readings with the original baseline. A sudden loss near a patch point often indicates contamination, poor mating, or a sharp bend. Gradual loss may suggest stress, aging, water exposure, or an incorrect cable route. Inspect enclosures physically, then retest after each correction. Do not replace a cable too quickly. That habit hides recurring installation problems. Still, some traces remain ambiguous, especially around closely spaced events. Experienced judgment is necessary.

Performance optimization starts with useful data. Set alarm thresholds from measured margins, not generic specifications alone. Protect bend-sensitive sections, improve slack management, and label both ends clearly. Automated monitoring can flag drift before service quality declines, but sensors also need verification. Review trends after seasonal temperature changes and maintenance work. I have seen clean-looking links fail because reference cords were worn. A perfect report is not always a perfect network. Leave room for rechecking.

2026 Top Factors Affecting Fiber Optic Cable Performance? - Testing, Troubleshooting, and Performance Optimization in 2026

Performance Factor Typical Data or Threshold Primary Effect Recommended Test Method Troubleshooting and Optimization Action
Fiber attenuation Single-mode fiber: approximately 0.35 dB/km at 1310 nm and 0.22 dB/km at 1550 nm. Multimode fiber is commonly around 3.5 dB/km at 850 nm and 1.5 dB/km at 1300 nm. Reduces optical power and limits link distance. Optical loss test using a calibrated light source and power meter at the operating wavelength. Compare measured loss with the link budget; inspect excessive cable length, sharp bends, poor splices, and damaged sections.
Connector insertion loss A clean, correctly installed connector is often designed for approximately 0.2–0.5 dB maximum loss, depending on the connector and project specification. Decreases received power and may consume the link budget. Reference-cord optical loss measurement at 850, 1300, 1310, or 1550 nm as applicable. Clean both mating surfaces with approved lint-free tools, inspect end faces, and replace damaged adapters or connectors.
Connector return loss Higher return loss is better. Typical UPC connections may be specified at 50 dB or higher, while angled connections are often specified at 60 dB or higher. Reflections can destabilize transmitters and degrade high-speed or analog optical systems. Optical time-domain reflectometer or optical return-loss test set. Use compatible polish types, eliminate contamination, verify connector mating, and avoid mixing incompatible end-face geometries.
Bend radius Follow the cable manufacturer’s minimum static and dynamic bend-radius specifications; a common field planning rule is at least 10 times the cable diameter for static storage and 20 times during installation unless otherwise specified. Causes macrobending loss, intermittent faults, and possible permanent fiber damage. Visual inspection, power-meter comparison before and after movement, and OTDR testing. Maintain bend-radius limits, remove tight cable ties, use wide-radius guides, and provide strain relief at closures and panels.
Microbending and installation pressure Localized pressure from over-tightened ties, crushed ducts, rough trays, or uneven clamps can produce wavelength-dependent loss. Adds distributed attenuation and may appear only after installation or temperature changes. OTDR comparison, launch-and-receive measurements, and inspection of the cable route. Use hook-and-loop fastening, maintain cable support, respect pulling tension, and remove compression points.
Splice quality A properly prepared fusion splice is commonly targeted at approximately 0.1 dB or less; actual acceptance limits depend on the project specification. Poor splices create localized loss and reflections. Bidirectional OTDR measurement, splice-loss estimation, and visual inspection of the splice tray. Re-strip and cleave contaminated fiber, verify alignment, control environmental conditions, and protect the splice correctly.
End-face contamination Dust, oil, and residue can increase insertion loss and back reflection; even microscopic contamination can affect single-mode connections. Produces unstable measurements, high loss, and permanent end-face damage if contamination is crushed during mating. Fiber end-face inspection with a suitable inspection microscope before cleaning and mating. Inspect, clean, and reinspect every connector; keep dust caps installed when ports are unused.
Wavelength selection Common test and transmission windows include 850 nm, 1300 nm, 1310 nm, and 1550 nm. Loss varies significantly with wavelength and fiber type. Testing at the wrong wavelength can hide attenuation or produce an incorrect link-budget result. Test at every wavelength required by the network design and acceptance specification. Match the source, meter, transceiver, and fiber type; record wavelength-specific results separately.
Optical link budget Budget includes fiber attenuation, connector loss, splice loss, patching, and an engineering margin. A practical margin is often 2–3 dB, subject to the system design. Insufficient margin leads to service instability as components age or additional patching is introduced. Calculate expected loss and compare it with measured end-to-end insertion loss and transceiver power limits. Reduce unnecessary connections, repair high-loss events, and validate minimum transmitter power and receiver sensitivity.
Temperature and humidity Outdoor and industrial cable systems must be selected for their specified operating temperature and environmental range; abrupt thermal changes can alter loss and mechanical stress. May cause intermittent attenuation, water ingress, jacket deterioration, or connector movement. Trend optical power and OTDR traces across temperature cycles; inspect seals, closures, and cable jackets. Use suitable outdoor-rated construction, seal closures, control slack, and investigate faults that correlate with weather changes.
Pulling tension and crush load Never exceed the cable’s rated short-term pulling tension or long-term tensile load. Values vary by cable construction and must be taken from the cable specification. Excessive force can stretch the fiber, damage the jacket, and create permanent attenuation. Monitor pulling tension, inspect the route, and compare pre-installation and post-installation loss measurements. Use appropriate pulling lubricant, pulling eyes, rollers, swivel devices, and route planning; do not pull by the connectors.
OTDR event interpretation Reflective peaks usually indicate connectors, mechanical splices, breaks, or open ends; non-reflective steps may indicate fusion splices or bends. Incorrect interpretation can lead to unnecessary replacement or missed faults. Use launch and receive fibers, suitable pulse widths, correct index settings, and bidirectional testing. Compare traces with the installation record, verify event distance, and confirm suspected faults with an insertion-loss test.
Test equipment calibration Light sources, power meters, OTDRs, inspection scopes, and reference cords should have current calibration and documented uncertainty. Uncalibrated equipment can produce false pass or fail results. Check calibration status, reference-cord condition, meter zeroing, and test-set self-tests. Use clean reference cords, verify test polarity, maintain calibration records, and repeat doubtful measurements with independent equipment.
Polarization mode dispersion PMD becomes more important at higher data rates and longer distances; acceptance limits are system-specific rather than universal. Creates differential delay and can reduce transmission margin. PMD analyzer measurement on links where the transmission design requires it. Use suitable fiber for the data rate and distance, avoid unnecessary high-stress handling, and evaluate the complete optical path.
Chromatic dispersion The effect increases with link length, source spectral width, and transmission speed; the allowable value is defined by the optical system design. Broadens optical pulses and can cause inter-symbol interference. Chromatic-dispersion measurement or calculation using fiber and transceiver parameters. Select compatible optics, reduce excessive span length, and apply dispersion management when required.
Preventive maintenance Record baseline insertion loss, OTDR traces, connector inspections, environmental conditions, and repair history for every critical link. Improves fault detection and reveals gradual degradation before an outage. Scheduled power-level trending, periodic inspection, OTDR comparison, and alarm-history review. Set threshold alerts, keep accurate cable-route records, retest after every change, and maintain spare protection for critical paths.

Note: Values shown are typical planning or field-reference ranges. Final acceptance limits should be taken from the applicable project specification, cable construction, optical equipment requirements, and current fiber-testing standards.

FAQS

What mainly determines fiber optic signal quality?

Core diameter, cladding alignment, and refractive-index profile control how light travels. Small manufacturing variations can increase attenuation or modal noise. Geometry matters.

How can cable bends reduce performance?

Tight corners can create macro-bending losses near cabinets, patch panels, and closures. Follow the specified minimum bend radius during installation and service. Sharp edges are dangerous.

Why do outdoor cables need special protection?

Outdoor cables face moisture, ultraviolet exposure, and repeated temperature changes. Suitable jackets and buffers reduce stress during expansion and contraction. Seasonal movement still matters.

How can dirty connectors affect a link?

Dust on an end face can scatter light and increase insertion loss within seconds. Inspect and clean both connector ends before mating. Tiny particles matter.

Which tests help verify fiber performance?

Insertion-loss testing checks the actual power budget. Optical return-loss testing reveals reflected power. OTDR traces can show damaged splices, reflections, and unexpected cable events.

Why should technicians compare new readings with baseline results?

Baseline loss provides a reference for later maintenance checks. A sudden change may indicate contamination, a sharp bend, or poor mating. One strange trace may reflect testing error.

What maintenance records are useful for fiber networks?

Record loss trends, bend locations, cleaning actions, temperatures, and environmental alarms. Include equipment calibration and test conditions. Records are not perfect, but they expose patterns.

Can a cable pass testing and still fail later?

Yes. Seasonal movement, moisture, aging, or rushed termination can create delayed problems. A clean spreadsheet may still mislead. Leave practical margin and recheck unusual results.

Conclusion

Fiber optic cable performance in 2026 depends on how efficiently a cable carries light signals with low attenuation, limited dispersion, and sufficient bandwidth. Key design factors include fiber type, core and cladding structure, cable construction, connector quality, splice accuracy, bend resistance, and protection against mechanical stress. Understanding what factors affect fiber optic cable performance helps network planners select suitable cable specifications for transmission distance, data capacity, and operating conditions.

Installation and environmental conditions also play a major role. Excessive bending, pulling force, moisture, temperature changes, vibration, contamination, and poor routing can reduce signal quality or shorten service life. Over time, aging, repeated handling, and inadequate maintenance may increase loss and create intermittent faults. Regular inspection, optical power measurement, loss testing, reflectometry, accurate fault location, and well-documented maintenance procedures support effective troubleshooting and performance optimization. By combining proper design, careful installation, continuous monitoring, and timely repairs, organizations can improve reliability, maintain stable connectivity, and extend the useful life of fiber optic networks.

Mason

Mason

Mason is a seasoned marketing professional with a deep expertise in the company's offerings and a passion for driving brand awareness. With a strong background in digital marketing strategies, he has an innate ability to connect with diverse audiences and effectively communicate product benefits.......